
In 2020, Exciton Science harnessed the full potential of its digital and social media platforms, helping us to make significant progress towards achieving the Centre’s strategic communication and outreach goals.
A total of 22,867 users visited https://excitonscience.com/ in 2020, a 92% year-on-year increase from 2019. Total pageviews also increased by 53.79% from 60,872 to 93,614.
This dramatic increase in website traffic was accompanied by only minor reductions in average session duration (-4%) and pages per session (-16%), demonstrating that a strong user journey and user experience remained in place, while quality and suitability of content for target audiences was enhanced.
The proportional sources of website traffic acquisition changed positively as a consequence of the success of our digital and social media strategy in 2020.
While organic search (from search engines such as Google) and direct traffic (website URLs typed into browsers or visited via bookmarked links) remained the largest sources of traffic at 34% and 37% respectively, traffic from social media increased by 620%, from 645 users in 2019 to 4,650 in 2020.
Social media provided 19.5% of total website traffic in 2020.
Referral traffic (users directed to the website via other sites) also increased by 73%, from 1,259 in 2019 to 2,180 in 2020, demonstrating a significant increase in Exciton Science’s digital presence across third party platforms.
The success of Exciton Science’s communications, media and outreach strategy is reflected in the site’s most visited individual webpages for the previous year. Of the top 25 pages, six were new items in 2020, including two news stories, the Solar Cell Challenge, the Light Ideas Design Competition and, most successfully, the ‘It’s on like Exciton’ arcade games section, which was established for National Science Week in August and became the third most-visited section of the website, accounting for nearly 5% of total website traffic for the year.

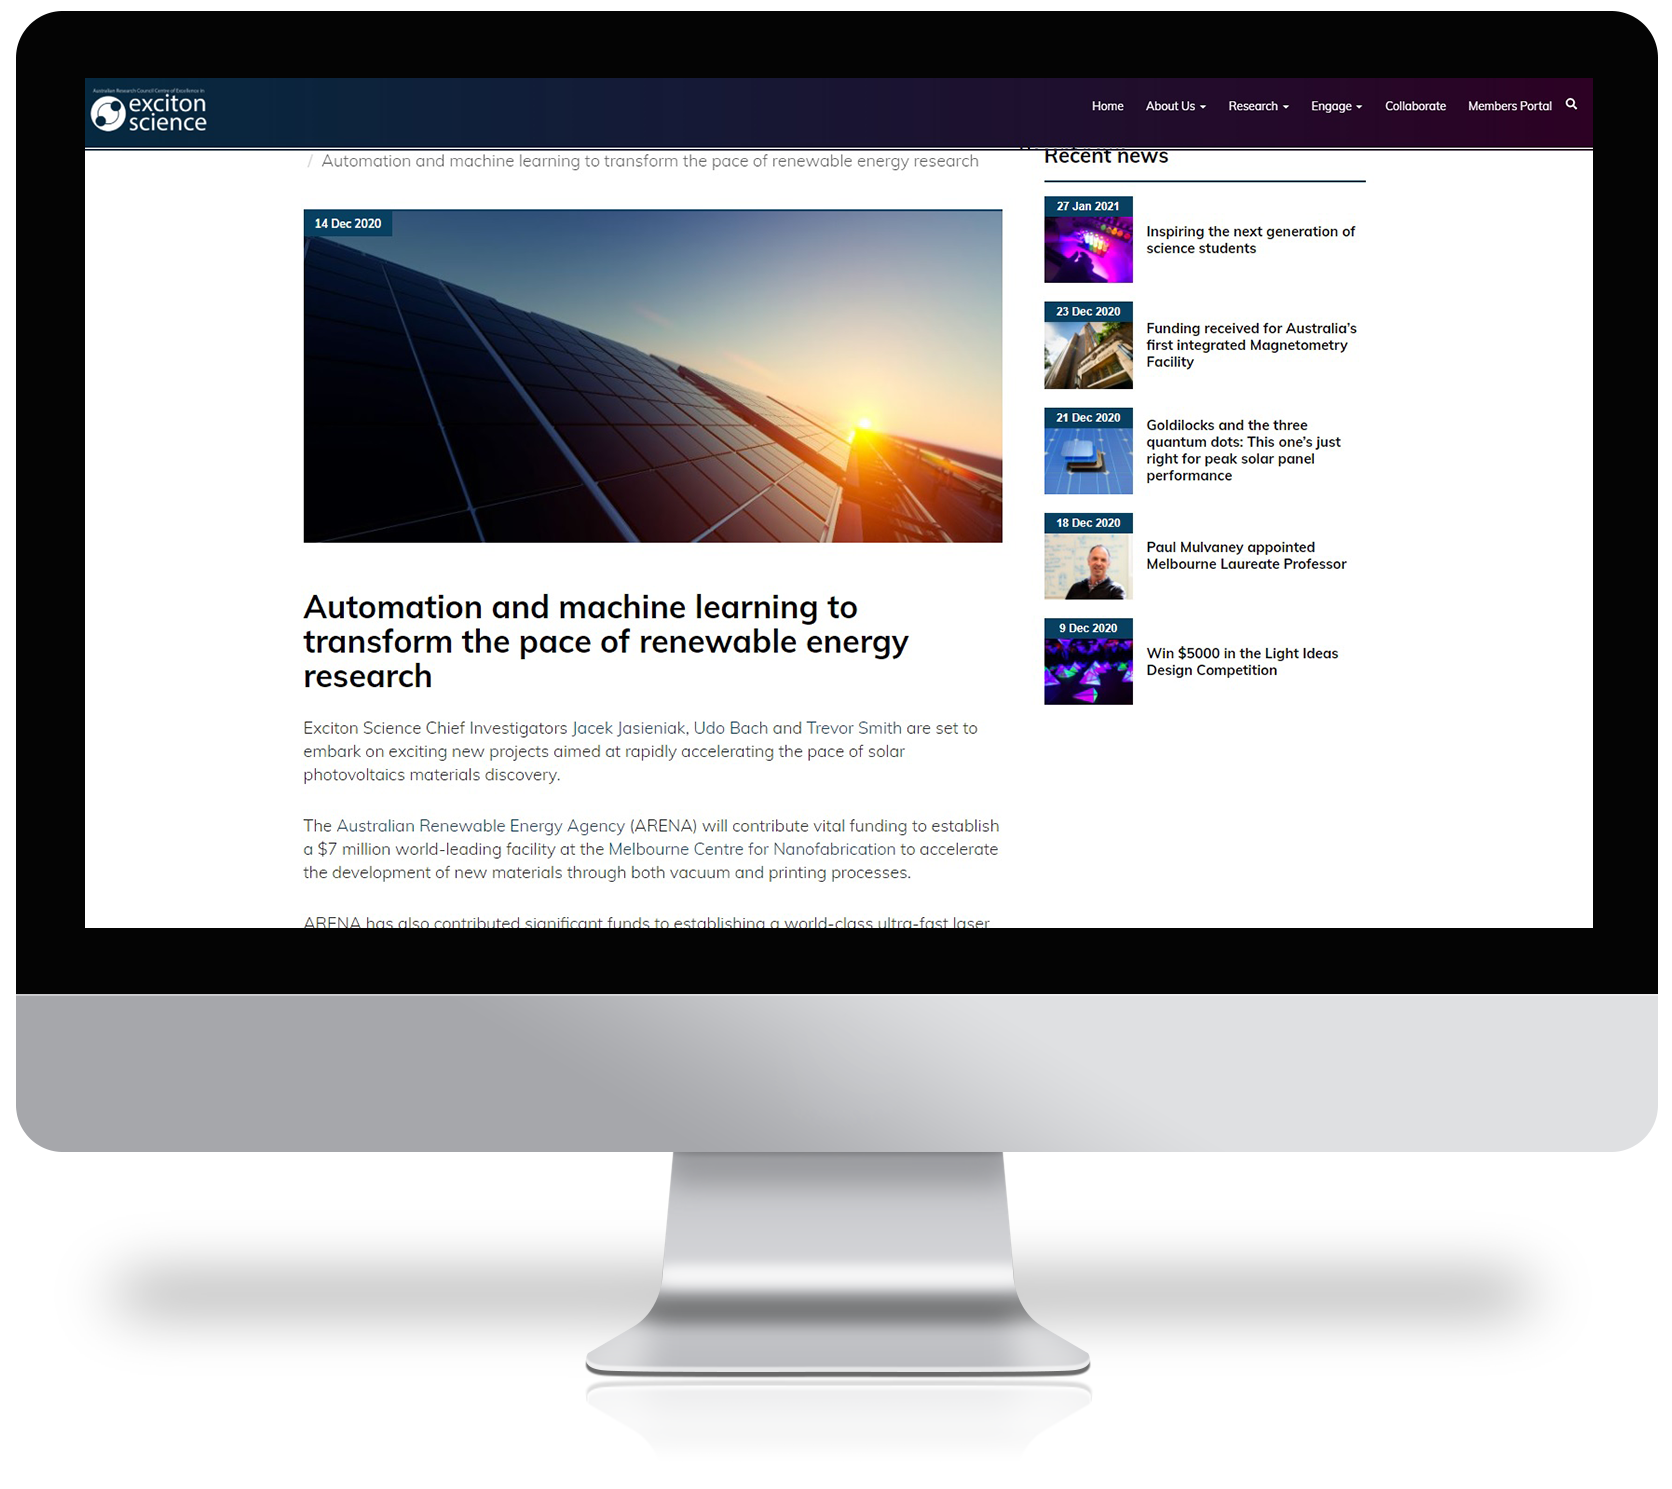
Exciton Science website
Website Visitors
% increase in Visitors
(compared to 2019)
As the preferred social media platform for many members of the scientific and research community, maintaining an active and engaged presence on Twitter and using the channel to communicate about results and individual and collective developments is a high priority for the Centre.
Total Twitter impressions for the year increased by 72% from 209,900 in 2019 to 361,800 in 2020. Profile visits increased 43% from 3,454 to 4,924 and 375 new users began following the Centre, a 19% improvement on 2019.
Total engagement (link clicks, retweets, likes and replies) increased 67% from 2,153 to 3,596.
Exciton Science also began to systematically employ the Centre Director’s Twitter account to amplify messaging and diversify the Centre’s output, resulting in a further 107,305 Tweet impressions, 1,681 profile visits, 169 new followers and total engagement of 1,659.
Beginning in April, Exciton Science has allocated a portion of the Media and Communications budget to boosting content directed at our target audiences on Facebook and Instagram
This has resulted in total page reach increasing 7,078% from 12,239 in 2019 to 878,556 in 2020, and engaged users increasing 2,086% from 1,209 to 26,431.
New page followers and new page likes increased 318% and 300% respectively from 54 and 53 in 2019 to 226 and 212 in 2020.
The Centre’s organic (non-paid) Instagram presence also grew considerably in 2020, with 91 new followers, 1,206 engagements, 4,332 post impressions, post reach of 3,618, post impressions of 428,000 and profile reach of 354,000.

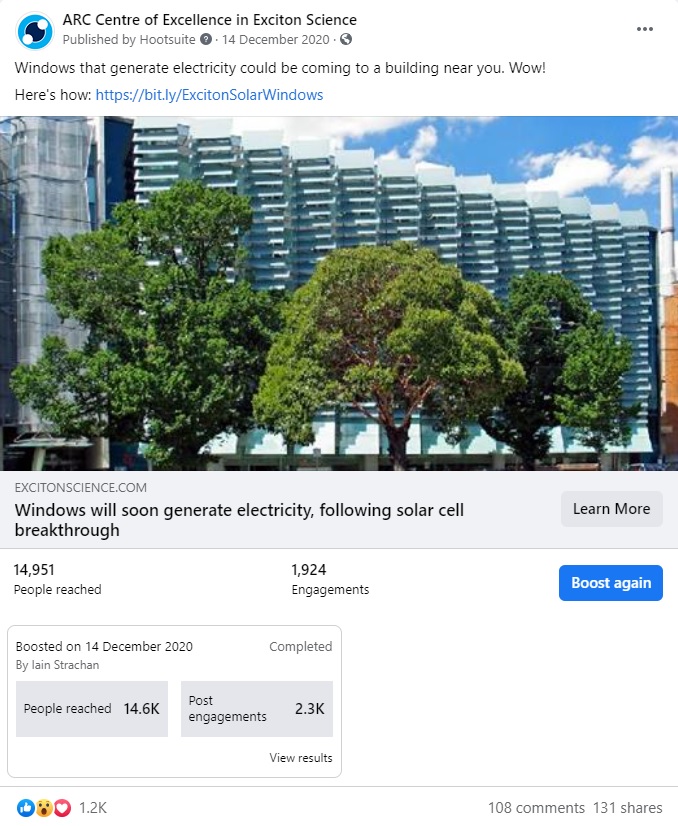
Exciton Facebook post

Exciton Instagram post
Exciton Science’s consistency of presence and engagement on LinkedIn expanded in 2020, with an average of six posts per month (51 in total annually) tailored to a professional, business and industry audience, resulting in a total of 309 followers and 1,486 instances of engagement.
The Centre established a YouTube channel in 2020, populated with promotional content for Outreach activities, recordings of lectures, online seminars, public lecture recordings and research news.
The channel recorded 1,323 views annually, with a total watch time of 56 hours, average view duration of 1:56.00 and 5,457 impressions.
We anticipate continuing to harness this channel to house diverse content for internal and external audiences in the year ahead.